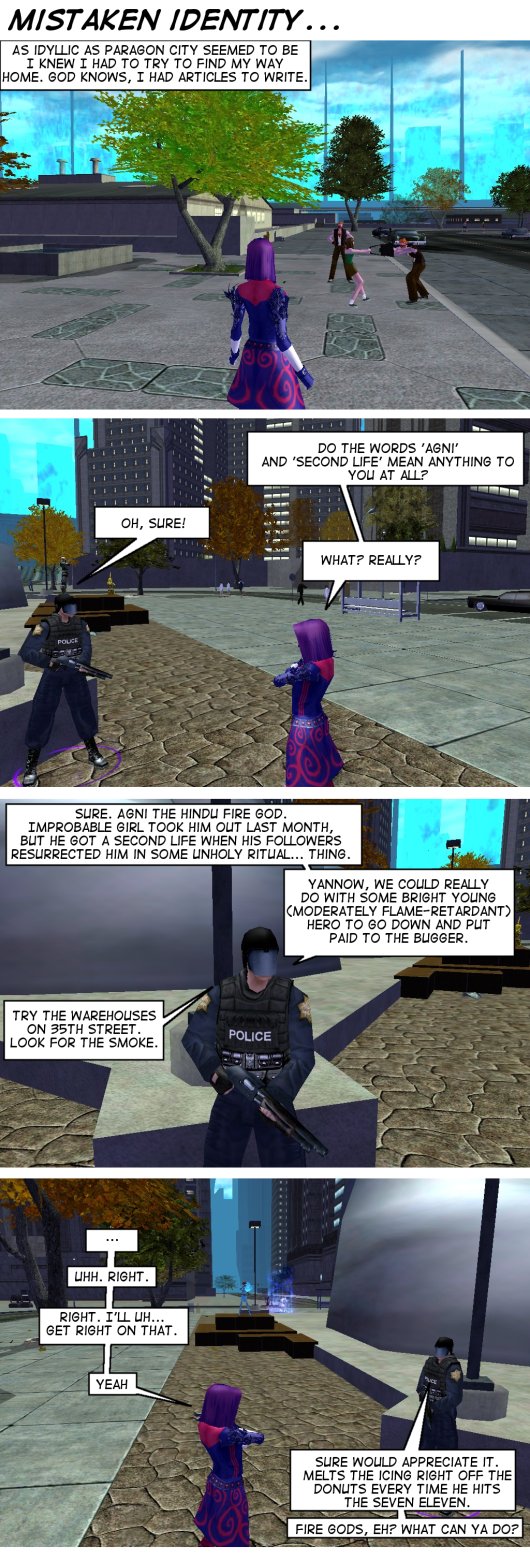
Comic - Mistaken Identity


Just a small note for Technorati watchers. Technorati ignores my comic posts, because they don't have enough actual text in them. If you're hanging on there, watching for new posts, you're better off with the RSS feed.
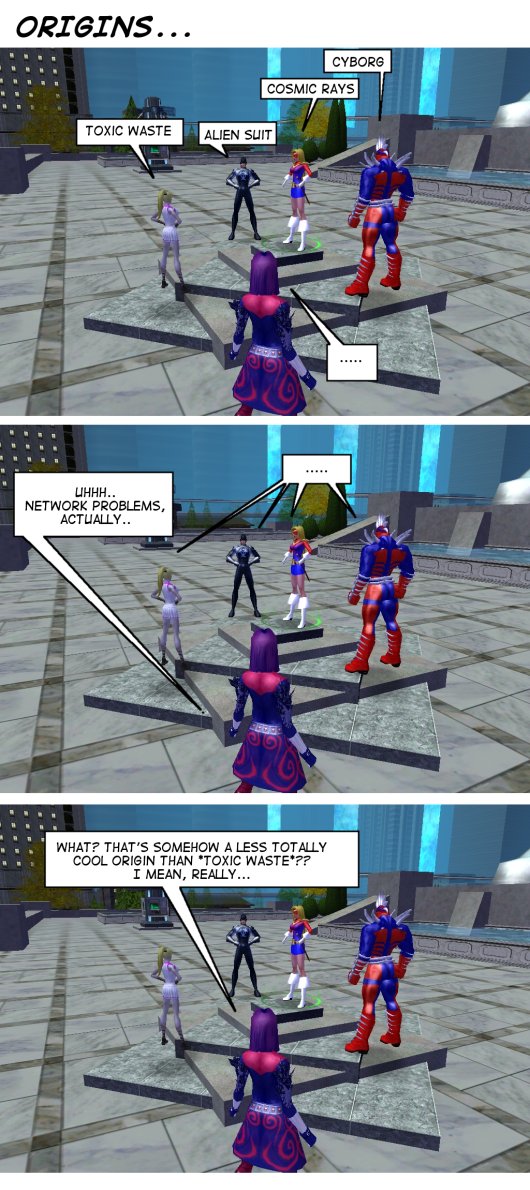
Dreamhost, who are holding my files and data, are having some problems with the server that it's all happening on. If things don't load up, be patient and try again in a bit.
I'm no happier about it than you are.
So, you know, I read a bit. The web, blogs, news, that sort of thing. I don't have a fifth gen gaming console, like the Wii, or Xbox-360, or PS3. Those things are way beyond my means, but you see a lot of news about them, bluster, sabre-rattling and failure rates.
It's pretty much axiomatic that after the launch of a new gizmo you'll get a lot of news pieces on the web about failures of this device or that. Too fragile, screen scratches too easily, unit sets fire to the cat, blows up grannies, and so on. It doesn't necessarily mean that there's actually any problem.
Dean Takahashi has a Q&A posted with Xbox hardware guy Todd Holmdahl. Go read it.
Now, this is how you don't deal with a unit-failure issue like this (real or imagined). Reading Holmdahl's responses, the reasonable reader can reasonably infer that there's a huge failure problem. Maybe there isn't, but Holmdahl makes it seem like there is one. He's practically screaming it in your face, so much so that it looks like a really, really big one.
How do you reasonably infer that? Imagine that you were in Holmdahl's position, and there was no problem at all. How would you answer the questions, in that case?
Now compare them with Holmdahl's answers - or perhaps I should say answer (singular) since he's really holding the line on this. See the difference? That difference is a disaster. Either from an actual unit-failures perspective, or from a PR perspective.
Whether there's a problem or not, he's just made a whole lot of people certain there is.
Here is the full ranked table of tracked sites for the week ending Sunday June 24, 2007:
| Site (* Native reality site) | Est avg hourly visits | Est avg hourly visits (peak hrs) | Estimated total weekly visits |
|---|---|---|---|
| * Phat Cat's Jazzy Blue Lounge | 178 | 193 | 30,048 (down 2%) |
| * Lost Gardens of Apollo | 83 | 107 | 14,052 (up 7% ) |
| * City of Lost Angels | 83 | 88 | 13,992 (up 5%) |
| * New Citizens Incorporated | 81 | 107 | 13,608 (up 9%) |
| IBM | 59 | 60 | 9,912 (up 2%) |
| * The Shelter | 56 | 64 | 9,504 (up 18%) |
| * Midgar | 55 | 63 | 9,336 (down 5%) |
| The Pond | 55 | 29 | 9,288 (up 33%) |
| The L Word | 39 | 50 | 6,684 (up 38%) |
| * Isle of Lesbos | 36 | 48 | 6,120 (up 33%) |
| Pontiac | 32 | 49 | 5,532 (up 25%) |
| * Ballers City | 21 | 26 | 3,612 (stable) |
| * Svarga | 20 | 27 | 3,504 (stable) |
| Weather Channel | 19 | 24 | 3,216 (up 56%) |
| Playboy | 17 | 20 | 3,000 (down 5%) |
| ABC Island | 15 | 14 | 2,652 (up 21%) |
| Microsoft | 15 | 20 | 2,640 (up 7%) |
| Nissan | 11 | 8.5 | 1,908 (stable) |
| Virtual Holland | 7.5 | 12 | 1,272 (up 73%) |
| NBA | 7.1 | 11.4 | 1,200 (down 24%) |
| AOL Pointe | 6.1 | 6 | 1,032 (down 25%) |
| Sun Microsystems | 4.2 | 12 | 720 (stable) |
| Comcast | 3.7 | 4.2 | 624 (stable) |
| Useful Technology | 3.3 | 1.1 | 564 (down 55%) |
| Dell | 2.1 | 2.8 | 360 (up 30%) |
| Coldwell Banker | 2.0 | 4.5 | 336 (stable) |
| Adidas | 1.6 | 1.7 | 276 (stable) |
| Reebok | 1.21 | 2.5 | 204 (stable) |
| Coca Cola | 1 | 2 | 180 (up 114%) |
The top ten, with commentary is posted to New World Notes.
Methodology
Mixed reality sites in this headcount are selected for their prominence, either from publicity or real world name recognition. Sites with consistent low traffic (500 or less weekly) may be dropped in future Headcounts in favor of other sites. We do not count sites with camping chairs, or visitors in the orientation sims, as there seems to be little evidence to suggest that they will become visitors to the parent site - and if they do, we catch them when we headcount the site anyway.
We collect data four times per day for each site at 2am, 8am, 2pm and 8pm (times in SLT/US Pacific) plus/minus 1 hour. For each sample we count the number of people at the site at the time. We average those samples across the week, and then assume that average to hold constant, with each visitor spending a half hour on-site. This methodology does not necessarily include one-time events that generate high traffic missed by our sampling, which we'll make note of whenever possible. Headcounts do not factor in returning visitors, so assume that the total number of unique Residents are likely to be significantly less than the estimated total visits.

The hosting service's server time jumped 8 hours into the past during the evening, preventing the automated data-collectors from functioning. Bonus - their support system is down for maintenance for a few hours.
Trying to get this looked at.
Technology is awesome.
I've managed to restore some semblance of order to the graphs by omitting the cached figures that are falsely spitting out Linden Lab's servers. There's a lot of holes in the data where LL is providing no data at all, but you can at least use the concurrency graphs again.
Here is the full ranked table of tracked sites for the week ending Sunday June 17, 2007:
| Site (* Native reality site) | Est avg hourly visits | Est avg hourly visits (peak hrs) | Estimated total weekly visits |
|---|---|---|---|
| * Phat Cat's Jazzy Blue Lounge | 183 | 188 | 30,756 (up 1%) |
| * City of Lost Angels | 78 | 81 | 13,236 (stable) |
| * Lost Gardens of Apollo | 78 | 89 | 13,104 (up 11% ) |
| * New Citizens Incorporated | 73 | 75 | 12,408 (up 4%) |
| * Midgar | 58 | 70 | 9,864 (up 4%) |
| IBM | 57 | 44 | 9,636 (up 63%) |
| * The Shelter | 47 | 60 | 8,004 (down 13%) |
| The Pond | 41 | 27 | 6,984 (down 5%) |
| The L Word | 28 | 37 | 4,812 (down 34%) |
| * Isle of Lesbos | 27 | 34 | 4,596 (stable) |
| Pontiac | 26 | 40 | 4,404 (up 24%) |
| * Ballers City | 21 | 20 | 3,606 (new) |
| * Svarga | 20 | 22 | 3,504 (up 49%) |
| Playboy | 18 | 17 | 3,181 (new) |
| Microsoft | 14 | 23 | 2,460 (up 66%) |
| ABC Island | 13 | 11 | 2,184 (down 13%) |
| Weather Channel | 12 | 13 | 2,052 (up 11%) |
| Nissan | 11 | 10 | 1,980 (up 20%) |
| NBA | 9.5 | 14 | 1,596 (up 25%) |
| AOL Pointe | 8.2 | 10 | 1,380 (up 4%) |
| Useful Technology | 7 | 21 | 1,260 (down 25%) |
| Sun Microsystems | 4.5 | 12 | 756 (up 650%) |
| Virtual Holland | 4.3 | 3.4 | 732 (up 28%) |
| Comcast | 3.8 | 2.8 | 650 (new) |
| Coldwell Banker | 2.7 | 4.8 | 468 (up 39%) |
| Adidas | 1.9 | 2.8 | 324 (up 92%) |
| Dell | 1.6 | 1.1 | 276 (down 39%) |
| Reebok | 1 | 0.8 | 168 (down 23%) |
| Coca Cola | 0.5 | 0.2 | 84 (down 28%) |
The top ten, with commentary is posted to New World Notes.
Methodology
We've changed the methodology slightly this week, based on discussions with and valuable insights from Gary Hazlitt and others. Instead of the previous three sample periods (peak concurrency, minimum concurrency and mid-evening Pacific time), we are now sampling four times per day, evenly spaced as noted below.
Mixed reality sites in this headcount are selected for their prominence, either from publicity or real world name recognition. Sites with consistent low traffic (500 or less weekly) may be dropped in future Headcounts in favor of other sites.
We collect data four times per day for each site at 2am, 8am, 2pm and 8pm (times in SLT/US Pacific) plus/minus 1 hour. For each sample we count the number of people at the site at the time. We average those samples across the week, and then assume that average to hold constant, with each visitor spending a half hour on-site. This methodology does not necessarily include one-time events that generate high traffic missed by our sampling, which we'll make note of whenever possible. Headcounts do not factor in returning visitors, so assume that the total number of unique Residents are likely to be significantly less than the estimated total visits.
Unavoidable RL stuff came up, and I wasn't able to make office hours for Thursday. Rescheduled to 10pm Friday instead.
Here is the full ranked table of tracked sites for the week ending Sunday June 10, 2007:
| Site (* Native reality site) | Est avg hourly visits | Est avg hourly visits (peak hrs) | Estimated total weekly visits |
|---|---|---|---|
| * Phat Cat's Jazzy Blue Lounge | 181 | 192 | 30,448 (up 6%) |
| * City of Lost Angels | 78 | 81 | 13,120 (up 4%) |
| * New Citizens Incorporated | 71 | 97 | 12,064 (down 2%) |
| * Lost Gardens of Apollo | 70 | 82 | 11,824 (down 2% ) |
| * Midgar | 56 | 64 | 8,552 (up 7%) |
| * The Shelter | 55 | 81 | 9,328 (up 4%) |
| The L Word | 44 | 68 | 7,456 (up 43%) |
| The Pond | 44 | 36 | 7,392 (up 12%) |
| IBM | 35 | 30 | 5,888 (up 13%) |
| * Isle of Lesbos | 27 | 31 | 4,560 (stable) |
| Pontiac | 21 | 32 | 3,536 (down 22%) |
| ABC Island | 15 | 13 | 2,624 (up 11%) |
| * Svarga | 14 | 15 | 2,448 (down 19%) |
| Weather Channel | 11 | 12 | 1,936 (down 11%) |
| Useful Technology | 10 | 15 | 1,744 (up 120%) |
| Nissan | 9.8 | 9.1 | 1,661 (up 15%) |
| Microsoft | 8.8 | 9.7 | 1,488 (down 1%) |
| NBA | 7.6 | 10 | 1,280 (up 65%) |
| AOL Pointe | 7.4 | 10 | 1,248 (up 4%) |
| Virtual Holland | 3.4 | 2.8 | 576 (down 25%) |
| Dell | 2.7 | 4.8 | 464 (stable) |
| Coldwell Banker | 2.0 | 3.1 | 336 (down 28%) |
| Reebok | 1.3 | 1.7 | 224 (up 48%) |
| Adidas | 1.0 | 1.4 | 176 (down 4%) |
| Coca Cola | 0.7 | 0.5 | 128 (down 23%) |
| Sun Microsystems | 0.6 | 0.8 | 112 (down 16%) |
A fair bit of slippage at the low end due to a rash of technical issues in Second Life during the course of the week, which made searching and much travel impossible.
Data collection note
Due to technical issues with Second Life this week, three samples were unable to be taken. We have substituted the data for the same sampling period from last week to make up for the loss.
Methodology
Mixed reality sites in this headcount are selected for their prominence, either from publicity or real world name recognition. Sites with consistent low traffic (500 or less weekly) may be dropped in future Headcounts in favor of other sites.
We collect data three times per day for each site, one sample at peak concurrency (10am-1pm SLT), one at minimum concurrency and one mid-evening, Second Life Time. For each sample we count the number of people at the site at the time. We average those samples across the week, and then assume that average to hold constant, with each visitor spending a half hour on-site. This methodology does not necessarily include one-time events that generate high traffic missed by our sampling, which we'll make note of whenever possible. Headcounts do not factor in returning visitors, so assume that the total number of unique Residents are likely to be significantly less than the estimated total visits.
We're able to cover multi-sim sites a lot better with this method, so you'll see those higher in the rankings than the previous metrics we were using.
With a hosting change in the works, I'm going back and refitting a lot of image and file links. This is causing the posts to show up on the feed again. Bear with me, there's still quite a few to do.
Next office hours will be 10PM Saturday, SLT. Thanks to everyone who attended the office hours for Thursday.
Why didn't I do this before? It worked out well.
Thankyou to everyone who showed up and participated in what was a lively, interesting and varied conversation.
Same time again on Thursday, 10pm SLT (US Pacific). Same place, Mars Japanese Gardens. See you then, same Tat-time, same Tat-channel.
If you want to catch up with me, ask a bunch of questions, offer tips or opinions - or if you want to subject yourself to some questions (I've got bunches), I'll be at the Mars Japanese Gardens (SLURL) tonight from 10pm SLT (US Pacific) for at least an hour (hardware and networks permitting). Feel free to come by and chat.
Here is the full ranked table of tracked sites for the week ending Sunday June 3, 2007
| Site (* Native reality site) | Est avg hourly visits | Est avg hourly visits (peak hrs) | Estimated total weekly visits |
|---|---|---|---|
| * Phat Cat's Jazzy Blue Lounge | 170 | 191 | 28,704 (up 2%) |
| * City of Lost Angels | 75 | 81 | 12,640 (up 4%) |
| * New Citizens Incorporated | 74 | 104 | 12,432 (up 8%) |
| * Lost Gardens of Apollo | 72 | 90 | 12,224 (down 6% ) |
| * Midgar | 53 | 67 | 8,992 (up 18%) |
| * The Shelter | 53 | 76 | 8,960 (up 13%) |
| The Pond | 39 | 28 | 6,640 (New) |
| The L Word | 31 | 53 | 5,328 (up 32%) |
| IBM | 31 | 30 | 5,296 (Stable) |
| Pontiac | 27 | 47 | 4,688 (down 3%) |
| * Isle of Lesbos | 27 | 30 | 4,544 (Returning) |
| * Svarga | 18 | 27 | 3,152 (Returning) |
| ABC Island | 14 | 12 | 2,480 (New) |
| Weather Channel | 13 | 16 | 2,336 (up 15%) |
| Microsoft | 9.0 | 14 | 1,520 (up 212%) |
| Nissan | 8.6 | 8.2 | 1,456 (Returning) |
| AOL Pointe | 7.1 | 9.1 | 1,200 (up 8%) |
| Useful Technology | 4.7 | 12.2 | 800 (Returning) |
| NBA | 4.6 | 6.2 | 784 (up 50%) |
| Virtual Holland | 4.6 | 2.5 | 784 (up 3%) |
| Coldwell Banker | 2.8 | 4.2 | 480 (up 50%) |
| Dell | 2.7 | 3.7 | 464 (up 62%) |
| Adidas | 1.1 | 1.7 | 192 (Returning) |
| Coca Cola | 1.0 | 1.1 | 176 (down 74%) |
| Reebok | 0.9 | 0.5 | 160 (Returning) |
| Sun Microsystems | 0.8 | 1.7 | 144 (up 42%) |
There's quite a bit of motion below the top ten as visitors came and went this week, but the trend is generally upwards. Coca Cola suffered falls, but establishing a specific site for their inworld public relations does not seem to be a part of their marketing plan.
We welcome back The Isle of Lesbos, Svarga, Nissan, Useful Technology, Adidas, and Reebok. New this week are The Pond, and ABC Island (that's the Australian Broadcasting Corporation, and not the American one) - both well-performing sites that have not seen a lot of international coverage.
Methodology
Mixed reality sites in this headcount are selected for their prominence, either from publicity or real world name recognition. Sites with consistent low traffic (500 or less weekly) will be dropped in future Headcounts for other sites.
We collect data three times per day for each site, one sample at peak concurrency (10am-1pm SLT), one at minimum concurrency and one mid-evening, Second Life Time. For each sample we count the number of people at the site at the time. We average those samples across the week, and then assume that average to hold constant, with each visitor spending a half hour on-site. This methodology does not necessarily include one-time events that generate high traffic missed by our sampling, which we'll make note of whenever possible. Headcounts do not factor in returning visitors, so assume that the total number of unique Residents are significantly less than the estimated total visits.
We're able to cover multi-sim sites a lot better with this method, so you'll see those higher in the rankings than the previous metrics we were using.